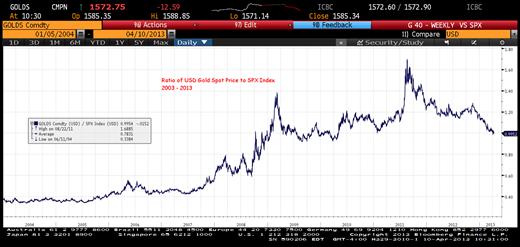
It is interesting to note that at the same time that the SPX index recorded its new all time high this morning (we like to include intraday prices for historical levels) the level of the index moved above the price of gold as the latter declined by nearly 1% to $1570.95.
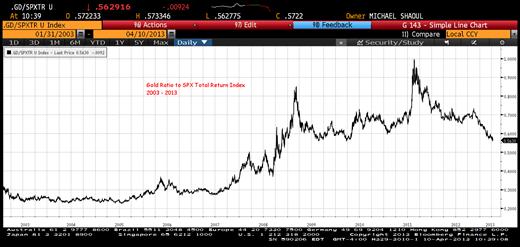
This takes the ratio of gold to the SPX back to where it was in 2010, although if dividends were included, the SPX index has now kept pace with gold since December 2008 (see total return chart). More importantly gold's performance over the last 5 years was heavily front loaded, enjoying powerful gains from late 2008 to mid 2011 and subsequently falling back into a long range bound malaise. The SPX on the other hand has enjoyed a much more balanced (if volatile) performance since bottoming in March 2009 and continues to enjoy a multi-month period of price appreciation.
This mismatch in timing means that after surging to a ratio of 1.68 to 1 in August 2011, gold has underperformed by a remarkable 68%. During most of this period investors heavily favored the metal over the US equity market, meaning they have fully participated in this relative under-performance (in nominal terms gold is down -17% from its August 2011 level and -18.2% from its September 2011 all time high). Should the SPX index continue to make further upward progress the pressure to reallocate out of gold is likely to to increase with the metal still dangerously close to key support at $1,520.